Why GA4 BigQuery Export Matters: The Difference Between Looking at Reports and Owning Your Data
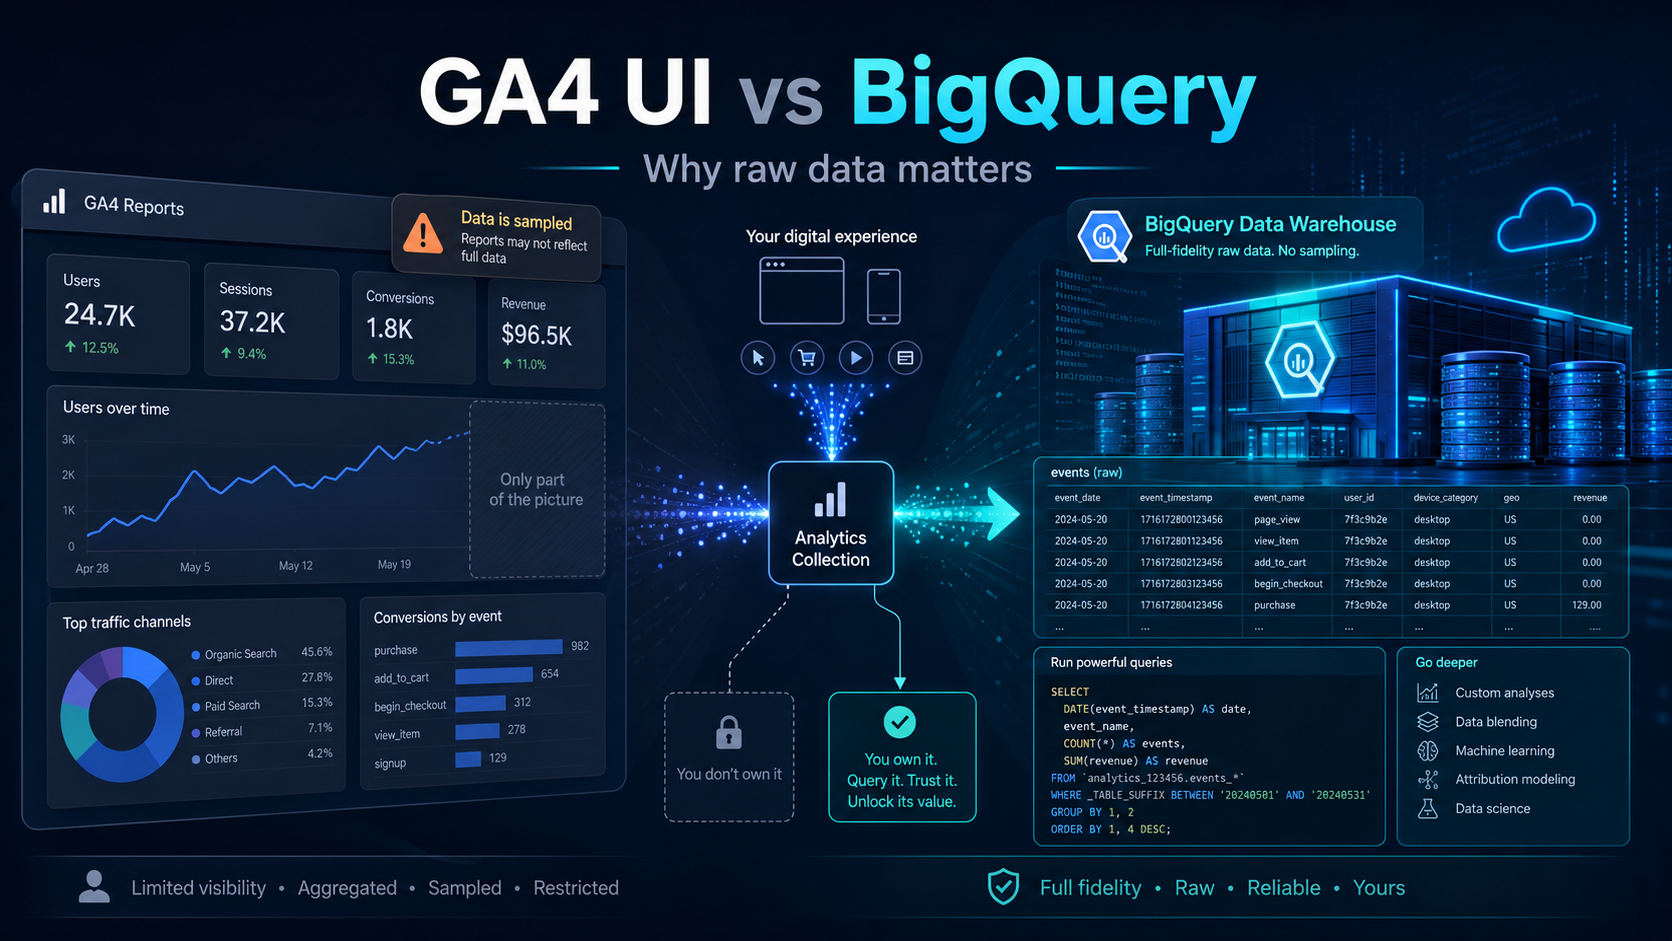
The GA4 interface is useful for quick reporting, but BigQuery gives teams access to raw event-level data, deeper debugging, reliable QA, and better analytics ownership.
Many companies use Google Analytics 4 in the same way: they open the GA4 interface, check traffic, conversions, pages, campaigns, and maybe a few explorations, then make decisions based on what they see there.
For many simple use cases, that is fine.
But if your website has a lot of events, many users, many marketing campaigns, complex conversion paths, or detailed tracking logic, relying only on the GA4 interface can become risky.
The reason is simple: the GA4 UI is a reporting layer. BigQuery is where you get access to the raw analytical data.
That difference matters a lot.
The GA4 interface is useful, but it is not the full data foundation
The GA4 interface is designed for quick analysis. It is good for answering questions like:
- How many users visited the site?
- Which channels generated traffic?
- Which pages performed best?
- How many conversions happened?
- Which campaigns are driving engagement?
This is valuable, especially for marketing and product teams.
But the GA4 UI is still an interface with limits. It is built for fast reporting, not for deep forensic analysis, long-term data modeling, or joining analytics data with other business systems.
When teams treat the GA4 UI as the only source of truth, they often miss important details.
The problem: GA4 reports can be sampled or limited
When the amount of data used in a GA4 report, exploration, or API request becomes large enough, Google Analytics may apply sampling. Sampling means GA4 uses only a portion of the available data and scales the result to estimate the full picture.
This does not mean the GA4 UI is wrong. It means the UI may not always show the full underlying dataset.
For example, if your website has:
- many custom events,
- high traffic volume,
- many dimensions,
- detailed campaign parameters,
- long date ranges,
- advanced exploration reports,
- complex segments,
- many page paths or content groups,
then your GA4 report may not always represent the complete raw event picture.
This is especially important when you are investigating tracking issues, conversion drops, campaign performance, funnel behavior, or unexpected reporting discrepancies.
Why this matters for business decisions
Imagine a marketing team checks GA4 and sees that a campaign generated 240 conversions.
Then the data team checks the raw event data and sees a different picture after deduplication, consent filtering, session reconstruction, CRM matching, or backend validation.
Which number should leadership trust?
The answer depends on the business question.
The GA4 interface may be useful for quick directional reporting. But when the question is financial, operational, or strategic, you usually need more control.
Examples:
- Why did conversions drop after the latest website release?
- Did a CTA stop firing because a CSS selector changed?
- Are duplicate events inflating conversion volume?
- Which user journey actually led to a qualified lead?
- Which campaign generated revenue, not just form submissions?
- Are consent changes affecting analytics collection?
- Are events missing parameters after a frontend deployment?
These are not simple dashboard questions. These are data quality and measurement engineering questions.
For that, BigQuery is much more powerful.
What BigQuery gives you that the GA4 UI does not
GA4 BigQuery Export gives you access to raw event and user-level data. That difference is exactly why BigQuery is valuable.
With BigQuery, you can:
- query raw GA4 events using SQL,
- inspect individual event parameters,
- debug tracking issues,
- build custom attribution logic,
- create your own session definitions,
- join analytics data with CRM or backend data,
- detect duplicate or missing events,
- model clean reporting tables,
- connect to BI tools,
- create QA monitoring,
- preserve historical data for deeper analysis.
Instead of only looking at aggregated reports, you can inspect the underlying event stream.
That is a completely different level of control.
Example: the GA4 UI shows conversions, but BigQuery explains why
Let's say GA4 shows that generate_lead conversions dropped by 35% last week.
In the UI, you might check traffic source, device, landing page, and maybe an exploration report.
But in BigQuery, you can go deeper:
- Did the event volume actually drop?
- Did the event fire but lose required parameters?
- Did the event name change?
- Did the CTA selector change?
- Did consent mode reduce observable analytics events?
- Did the conversion happen but arrive under another event name?
- Did mobile traffic behave differently from desktop?
- Did a specific page template stop sending events?
- Did the same user trigger duplicate events before the drop?
The UI can show that something changed.
BigQuery can help explain what changed.
BigQuery is also important for data quality monitoring
One of the biggest risks in digital analytics is silent failure.
A developer changes a button class. A data layer variable disappears. A form changes structure. A tracking rule still exists in GTM, but the selector no longer matches anything.
Nothing crashes. The website still works. But analytics silently breaks.
If nobody checks the raw data, the issue may only be discovered weeks later when someone notices a strange dashboard trend.
With BigQuery, you can build automated checks such as:
- event volume dropped by more than expected,
- required parameters are missing,
- a conversion event stopped firing,
- one page template sends different parameters than others,
- traffic source mapping changed,
- duplicate events increased,
- consent state distribution changed,
- new unknown event names appeared,
- important event parameters became null.
This turns analytics from a passive reporting system into an actively monitored measurement system.
That is the difference between having GA4 installed and trusting your measurement infrastructure.
BigQuery makes GA4 more useful for data engineering
For data teams, the GA4 interface is usually not enough.
They need clean, modeled, queryable datasets.
The raw GA4 export can become the bronze layer of an analytics pipeline. From there, teams can create:
- cleaned event tables,
- session tables,
- user journey tables,
- conversion tables,
- marketing attribution tables,
- campaign performance models,
- product usage datasets,
- BI-ready reporting views.
This is where tools such as SQL, dbt, BigQuery scheduled queries, Looker Studio, Power BI, Tableau, or Snowflake-style modeling patterns become useful.
The goal is not simply to export GA4 data.
The goal is to build a reliable analytical foundation.
When the GA4 UI is enough
BigQuery is powerful, but not every business needs to start with complex data pipelines.
The GA4 UI may be enough if:
- the website is small,
- traffic volume is low,
- reporting needs are simple,
- there are few custom events,
- decisions are not highly dependent on precise event-level logic,
- no one needs to join analytics data with CRM, product, or revenue data.
For simple monitoring, the UI is fast and convenient.
But as soon as analytics becomes important for revenue, product decisions, paid media optimization, or executive reporting, BigQuery becomes much harder to ignore.
When BigQuery becomes necessary
You should strongly consider GA4 BigQuery Export when:
- you have high event volume,
- you use many custom events,
- GA4 reports or explorations show sampling,
- different teams report different numbers,
- you need to debug tracking issues,
- you need raw event-level analysis,
- you need to join GA4 with CRM or backend data,
- you want long-term historical control,
- you need automated tracking QA,
- you want BI dashboards built from governed datasets.
In other words: if analytics is important enough to influence business decisions, it is important enough to store and model properly.
The key mindset shift
GA4 should not be treated only as a dashboard.
It should be treated as one part of a measurement system.
A mature setup looks more like this:
Website / App
-> GTM / Server-side GTM
-> GA4
-> BigQuery Export
-> Data modeling
-> QA checks
-> BI dashboards
-> Business decisions
The GA4 interface is still useful.
But BigQuery gives you ownership, flexibility, and deeper analytical control.
That is why serious analytics teams do not stop at the GA4 UI.
They connect GA4 to BigQuery and build their own reliable measurement layer on top.
Final thought
Checking GA4 reports is easy.
Trusting the data behind those reports is harder.
BigQuery helps bridge that gap.
It gives analytics, marketing, product, and data teams access to the raw event data they need to investigate issues, validate tracking, build reliable reporting, and avoid making decisions from an incomplete picture.
For modern digital measurement, that is not a luxury.
It is the foundation.